

rasa inspect opens the new Inspector by default — a unified inspection experience for both chat and voice that gives you a single, consistent interface for understanding what happened and why it happened. It brings clearer execution traces, better failure visibility, and flow history into the same view.
The previous Inspector remains available as a temporary fallback by adding the --legacy flag:
Interface Description
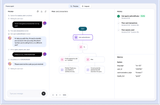
rasa inspect command starts an assistant based on the last trained model and opens a new tab in the browser. On large screens with inspect mode active, the interface shows three panels side by side:
- Preview (left) — chat with your assistant and see inline conversation events,
- Flow (center) — a live flowchart of the currently active flow, and
- History and Memory (right) — a chronological record of flow invocations and the slots collected so far.
Preview
The Preview panel is where you chat with your assistant. Each message exchange is shown in the conversation log along with inline events (slot sets, action executions, and similar). The header provides quick actions:- Copy — copies the conversation to the clipboard.
- Download — exports the conversation as E2E test cases or raw tracker logs.
- Langfuse (visible when configured) — opens the Langfuse trace for the current session. Enable it by adding a Langfuse tracer to
endpoints.yml:
- Restart — discards the current session and starts a new conversation.
- Sub-agent iterations, tool calls, and MCP tool activity are shown inline, so you can see exactly what the agent did and in what order.
- Failures and ambiguous turns are surfaced clearly — what the agent attempted, where it broke, and why — so root-cause discovery is faster and doesn’t rely on manual guesswork.
Flow
The Flow panel visualizes the currently active flow as a flowchart. As the conversation progresses, the active node is highlighted and the view scrolls to follow it. Clicking any node opens the Event Details panel, where you can inspect the specific event associated with that step.History
The History panel shows a chronological timeline of every flow invocation in the current session. Each entry displays:- Flow name — the human-readable name of the invoked flow, or
Sub-agent: <id>for autonomous sub-agent calls. - Status badge — the current state of the invocation:
Active,Interrupted,Completed, orCancelled. - Start time and duration — when the invocation began and how long it ran.
Memory
The Memory panel shows the slots collected during the conversation, organized by scope:- Current flow — slots set within the flow that is currently active.
- Session — slots set at session level, outside of any single flow.
- System — internal system slots (locale, session metadata, and similar).
Inspecting Voice Assistants
Rasa Inspector can also be used for testing voice conversations. The local Inspector runs with voice enabled automatically — no extra flag is required. It uses Deepgram for speech recognition, so the only thing you need to set is theDEEPGRAM_API_KEY environment variable. Then launch the Inspector as usual:
rasa inspect --voice on its own raises an error, since voice is already part of the default Inspector. To test voice with the legacy Inspector instead, run rasa inspect --legacy --voice.
Check out the speech integrations page for the full list of supported ASR and TTS providers and their environment variables.
Inspecting Conversations over External Channels
Rasa Inspector can also be used to debug conversations happening on external channels. When you have certain channels defined incredentials.yml, you can run Rasa with Inspector using the command rasa run --inspect. To use the legacy Inspector for external channel debugging, add the --legacy flag: rasa run --inspect --legacy.
Rasa will create Inspector URLs for each channel. You can start a conversation over the external channel and view the conversation on Rasa Inspector along with all the relevant information about the conversation. It can be used to inspect conversations over any external channel including voice channels (like Twilio Media Streams).
Inspector Socket.IO path and coexistence with the Point custom clients at
socketio channelThe Inspector’s Socket.IO transport listens on /inspector.io by default. The socketio channel keeps its default /socket.io path, so you can declare both channels in the same credentials.yml:credentials.yml
/inspector.io to reach the Inspector’s Socket.IO endpoint, or override the path with socketio_path under inspector:. If you give two Socket.IO channels the same socketio_path, Rasa fails to start with a RasaException that names both channels. Set a distinct socketio_path on all but one of them to resolve it.credentials.yml contains the channel you would like to inspect:
credentials.yml
rasa run --inspect. Open the inspector URL mentioned in the logs:
rasa run --inspect --legacy), the URL is the plain form: