
Understanding AI Agent Metrics in Contact Centers
When you work on AI agents for contact centers, you need to speak the same language as the contact center leaders evaluating your work. They have specific metrics and methods to measure success, and understanding what each one actually captures (and what it misses) makes collaboration much smoother.
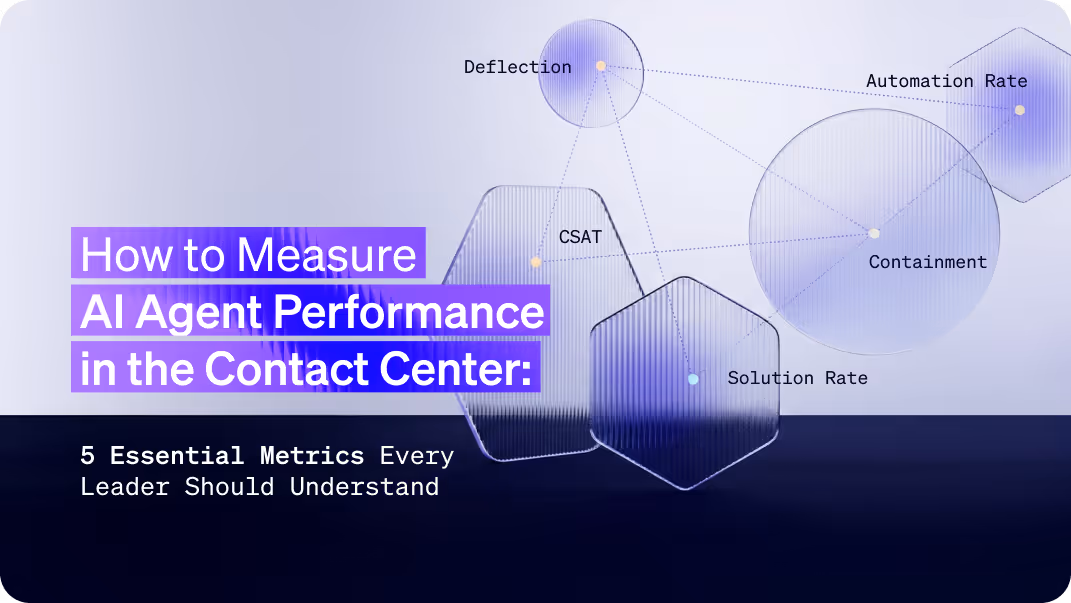
The 5 core metrics you'll likely encounter if you are working on an AI Agent in the contact center:
- Deflection Rate - Conversations handled without human agents
- Containment Rate - Resolutions without cross-channel follow-ups
- Automation Rate - Completed workflows and processes
- Solution Rate/Resolution Rate - Customer-confirmed problem resolution
- CSAT/NPS - Customer satisfaction scores
Some of these measure operational efficiency. Others measure customer outcomes. Some contact centers typically track all five (and many more), but they're not equally useful for every decision you'll make.
This guide explains what each metric measures, how to calculate it, when contact center teams rely on it most, and what it doesn't tell you. I've worked with contact center leaders on AI agent implementations, and these are the metrics that I often encountered in conversations about performance.
Importantly, before diving in, it’s also worth mentioning that the formulas outlined below may deviate from project to project. Deflection is a pretty standard metric, but I’ve seen metrics like resolution rate/solution rate referred to by different names and measured differently. Your AI agent team will likely be asked to mirror the contact center's measurement approach, which is a good practice for comparing the effectiveness of your AI agent with other channels.
The 5 Contact Center AI Metrics That Actually Matter
Contact center leaders evaluate a wide range of metrics. Below, I’ve tried to isolate the 5 most relevant for AI Agents. Each one reveals different aspects of performance, and understanding where each metric excels (and where it misleads) helps you build better implementations and have more productive conversations with stakeholders.
Let's break down what each metric actually measures.
1. Deflection Rate: The Most Popular Metric (With Serious Limitations)
What it measures: The percentage of customer inquiries your AI handles without transferring to a human agent.
The formula:Deflection Rate = (AI agent conversations without human transfer / Total # AI agent conversations) × 100
Example: 1,000 conversations, 750 handled by AI alone = 75% deflection rate
Why Deflection Is Widely Used
Deflection directly impacts contact center costs. Fewer human agent interactions = lower operational expenses. It's straightforward to calculate and easy to present to executives as ROI.
Where Deflection Falls Short
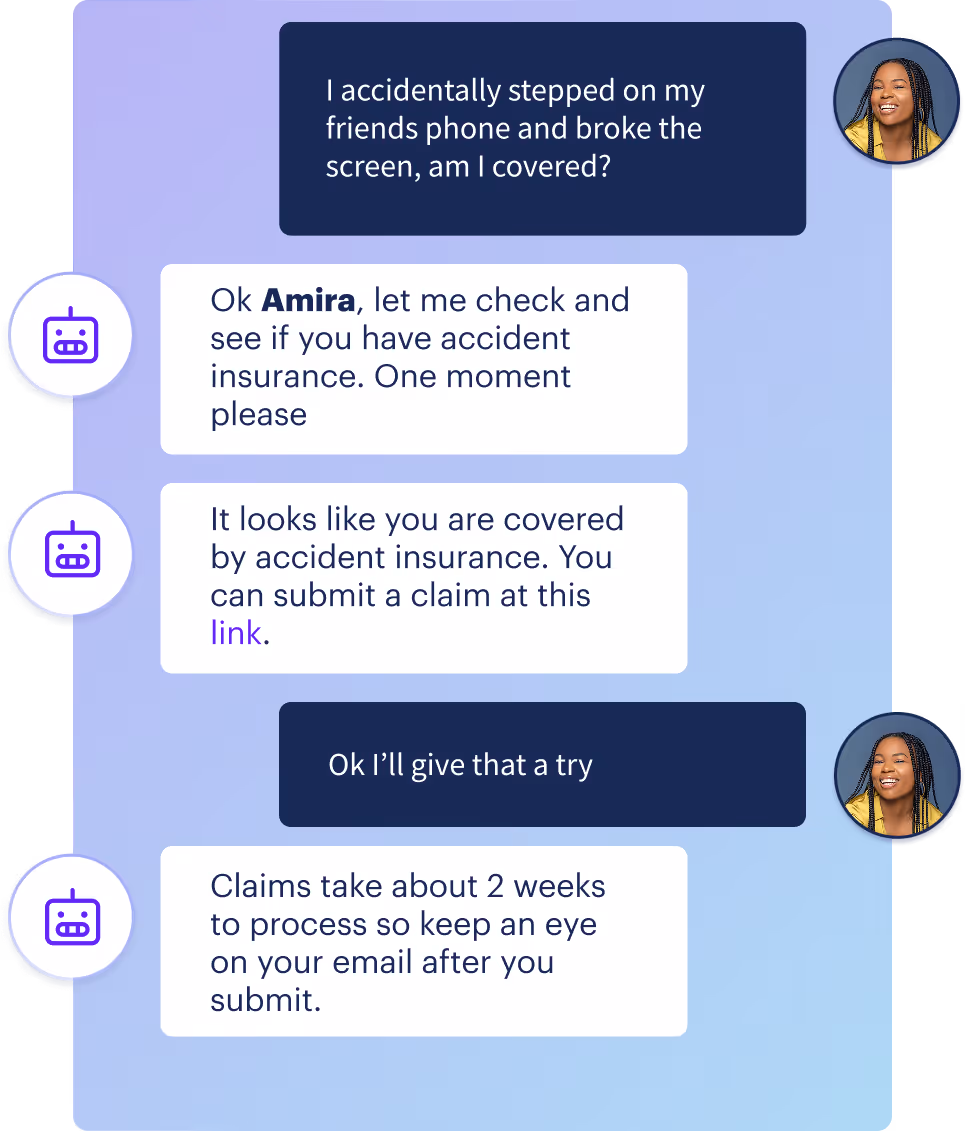
The problem with deflection is that it can't distinguish between "AI solved the problem" and "the customer couldn't reach an agent."
Scenario that counts as "deflected":
- Customer asks for help with a complex issue
- AI provides generic information that doesn't help
- Customer asks to speak with an agent
- The system doesn't provide an escalation option
- Customer leaves frustrated

Here, in the image above, the agent didn't solve anything, but this conversation shows up as successfully deflected.
What Deflection Is Good For
Deflection works well when paired with other metrics. Use it to track:
- Overall AI handling volume
- Cost reduction potential
- Trends in agent escalation rates
What Deflection Misses
- Customer satisfaction with the interaction
- Whether the customer's problem was actually solved
- Whether customers escalated through other channels
- Quality of the AI interaction
How to use it effectively: "Our deflection rate is 65%, and our CSAT is 70%. We monitor both to ensure we're solving problems, not blocking access to help."
2. Containment Rate: Measuring True Resolution Across Channels
What it measures: The percentage of AI conversations where the customer doesn't return through another channel for the same issue.
The formula:
Containment Rate = (AI Agent conversations with no follow-up on same issue / Total # AI agent conversations) × 100
Example: 800 AI conversations, 640 with no follow-up = 80% containment rate
What Containment Adds to Deflection
Containment provides a more complete picture than deflection alone.
For a query to be "contained":
- The customer doesn't escalate to a live agent, AND
- The customer doesn't call, email, chat again, or reach out via email or social media about the same problem.
Deflection tells you the AI didn't hand off to a human. Containment tells you the customer didn't need additional help.
The Measurement Challenge
I want to really highlight that tracking true containment is truly a challenging endeavor; it requires:
- Cross-channel integration (chat, email, phone, social)
- User identification across platforms
- Issue tracking that connects related inquiries
- A defined, yet arbitrary time window (typically 24-48 hours)
Many contact centers don't yet have this level of integration. Plus, not all users are “logged in” during every conversation. I’ve also been on many projects where the unique user ID assigned to a user in my agent was different from the one they were assigned in other contact center channels, like live agent messaging. This made it impossible to truly track users and their respective issues over channels and systems. That's common - it's also valuable to know where your tracking capabilities have gaps.
In my opinion, many contact center folks use the term 'containment' interchangeably with 'deflection,' which is confusing. So anytime you hear the word 'containment,' double-click on that term to find out exactly what it means.
What Containment Is Good For
- Validating that AI interactions actually resolved issues
- Identifying workflows that seem successful but generate follow-ups
- Understanding the complete customer journey
What Containment Misses
- Anonymous user behavior (can't track across sessions). Some results send users to other channels that cannot be easily cross-referenced (i.e., email).
- Issues that evolve into different problems
- Customer satisfaction with the resolution process
How to use it effectively: "We track containment across chat, voice, and messaging with high confidence, representing about 75% of our support volume. Based on what we can measure, our containment rate is 78%. We're working on other channel integrations, like email, to get a complete picture."
3. Automation Rate: Measuring Process Completion
What it measures: The percentage of interactions where your AI agent guided customers through a complete workflow, something I’ve also seen called an “issue”. A workflow in this circumstance might be something like “file_claim” for insurance, “card_replacement” for banking, or “router_reset” for telecom.
The formula:
Automation Rate = (Completed workflows / Total # of workflows started) × 100
Example: 600 customers started claim filing, 480 completed it = 80% automation rate
What Automation Rate Tells You
Automation rate shows how effectively your AI moves customers through a process. It's useful for understanding:
- Which workflows can customers complete independently
- Where customers drop off in multi-step processes
- Process efficiency and completion trends
Where Automation Rate Falls Short
Automation measures completion, not satisfaction or success. A customer can complete a workflow without solving their underlying problem.
Real scenario:
- Customer completes password reset flow (automated ✓)
- The new password doesn't work due to a system issue (problem unsolved ❌)
- Customer asks to reset password again (automated ✓)
- The new password doesn't work again due to a system issue (problem unsolved ❌)
- Automation rate: (2/2) 100%
- Customer outcome: Negative
What Automation Rate Is Good For
- Identifying workflow friction points
- Measuring operational efficiency
- Tracking which processes work well for self-service
- Understanding where customers need help mid-process
What Automation Rate Misses
- Customer satisfaction with the process
- Whether the workflow outcome helped
- Whether customers found the process confusing
- Whether the completed process solved the original problem

How to use it effectively: "Our automation rate is 74%. We track this alongside solution rate (64%) and CSAT (81%) to understand whether automated workflows are creating value or just pushing customers through processes."
4. Solution Rate: Measuring Customer-Confirmed Resolution
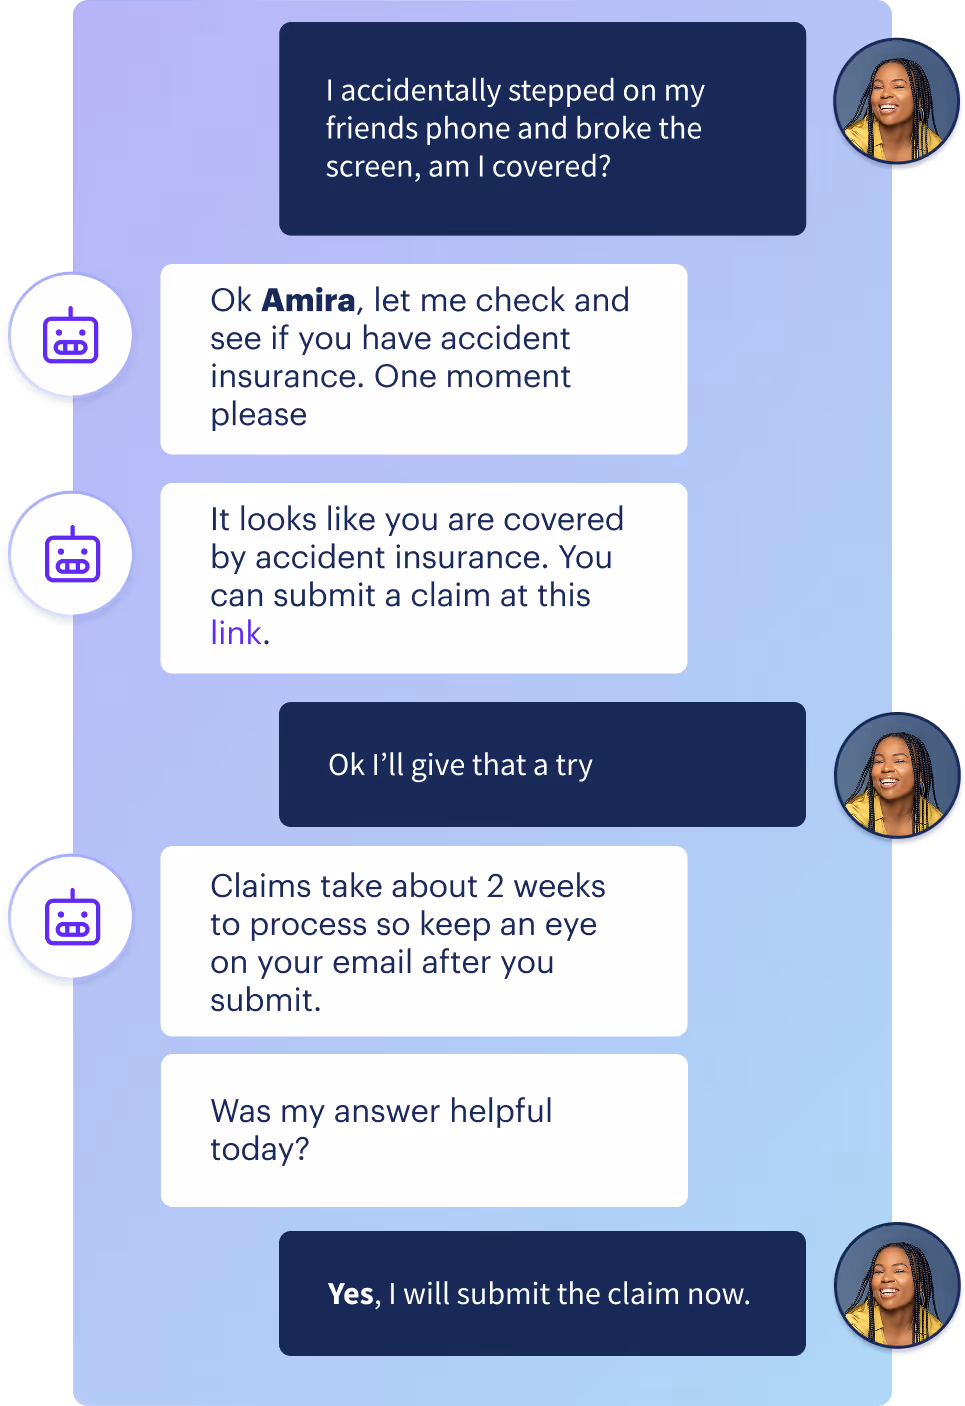
What it measures: The percentage of AI interactions where customers confirmed their problem was solved.
The formula:
Solution Rate = (Confirmed solutions / Total # of conversations that provided solution feedback) × 100
Example: 1,000 inquiries, 730 customers confirmed resolution = 73% solution ratio
What Makes Solution Rate Different
Solution Rate (sometimes called “resolution rate”) is the only metric that requires explicit customer confirmation. It measures whether the customer believes their problem was solved, not whether:
- A workflow was completed
- An agent was avoided
- The customer stopped contacting you
How to Measure Solution Rate
Collect feedback immediately after providing a solution:
Simple binary feedback: "Did this resolve your issue?"
[Yes] [No]
Rating scale: "Was this helpful?"
👍 👎
Critical: Ask after every interaction, not just ones you think went well. Non-selective feedback collection prevents bias.
What Solution Rate Is Good For
- Understanding actual problem resolution rates
- Identifying which issue types your AI handles well
- Getting direct customer validation of AI effectiveness
- Prioritizing which workflows need improvement
What Solution Rate Misses
- Why unresolved issues failed
- Customer satisfaction with the process (even when resolved)
- Issues where customers don't provide feedback
How to use it effectively: "Our solution rate is 73%, based on direct customer confirmation. This is our primary success indicator because it measures actual problem resolution. We use this alongside CSAT to understand both resolution and experience quality."
5. Which Customer Satisfaction Metric Should You Use?
Customer satisfaction metrics answer a crucial question: Do customers actually like interacting with your AI?
But CSAT and NPS measure different things. Here's how to choose.
CSAT: Customer Satisfaction Score
What it measures: How satisfied customers are with a specific AI interaction.
The formula:
CSAT = (Satisfied customers / Total survey responses) × 100
Example: 1,000 surveys sent, 820 rated "satisfied" (4-5 stars) = 82% CSAT
How to collect it: "How would you rate your experience today?"
⭐⭐⭐⭐⭐ (count 4-5 as satisfied)
Or simply:
😊 Satisfied | 😐 Neutral | ☹️ Dissatisfied
NPS: Net Promoter Score
What it measures: Likelihood to recommend your company overall.
The formula:
NPS = % Promoters (9-10 ratings) - % Detractors (0-6 ratings)
Example:
- 60% rated 9-10 (Promoters)
- 25% rated 7-8 (Passives, not counted)
- 15% rated 0-6 (Detractors)
- NPS = 60% - 15% = 45
How to collect it: "How likely are you to recommend [Company] to a friend?"
0-10 scale
The Critical Difference for AI Agents
CSAT = Transactional. Measures this specific interaction.
NPS = Relational. Measures overall brand loyalty.
When to Use CSAT for AI (Most of the Time)
Use CSAT when you need:
- ✅ Immediate feedback on AI performance
- ✅ Data to optimize specific workflows
- ✅ Comparison between AI agent and human agent performance
- ✅ Actionable insights to improve conversation flows
- ✅ Metrics that directly reflect AI agent quality
Why it works: If your password reset experience has a CSAT score of 60%, you know it needs work. You can fix it, deploy it, and see CSAT improve. Direct cause and effect.
When to Use NPS for AI (Strategic Monitoring Only)
Use NPS when you need:
- ✅ Long-term brand loyalty tracking
- ✅ Executive-level strategic reporting
- ✅ Understanding if AI implementation helps or hurts relationships
- ✅ Comparison to industry benchmarks
Why it's limited: NPS reflects product quality, pricing, brand reputation, competitor actions, and hundreds of other factors beyond one AI chat. If NPS drops, you won't know if it's your AI, a price increase, a product issue, or something else.
The Reality Check: CSAT Is More Useful for AI Optimization
Here's what nobody tells you about NPS for AI agents:
NPS is too distant from AI performance. A customer can have a perfect AI interaction (should boost NPS) but still rate you low because your product broke (tanks NPS anyway). You fixed the AI for nothing.
CSAT connects directly to AI improvements. Low CSAT on a specific flow? Fix that flow. CSAT improves. You know the AI change worked.
How CSAT and NPS Relate to Other AI Metrics
CSAT should move with your efficiency metrics. When it doesn't, you have problems:
Red flags:
- ⚠️ Rising deflection + falling CSAT = You're blocking customers from help
- ⚠️ Rising automation + flat CSAT = You're automating bad experiences
- ⚠️ High containment + low CSAT = Customers gave up, didn't get helped
- ⚠️ High deflection + falling NPS = AI is damaging brand loyalty
Green lights:
- ✅ Rising deflection + stable CSAT = Efficient AI that customers like
- ✅ Rising automation + rising CSAT = Workflows that actually help
- ✅ High solution rate + high CSAT = AI is genuinely solving problems
Best Practice: Track Both, Optimize for CSAT
The smartest contact center teams use both metrics differently:
CSAT = Operational metric. Use it to optimize AI workflows, conversation design, and escalation paths. When CSAT is low on a specific flow, fix that flow.
NPS = Strategic warning system. Monitor it to ensure AI implementation doesn't harm overall customer relationships. If NPS trends down as AI usage increases, investigate whether AI is creating systemic problems.
Effective reporting approach: "Our CSAT is 72%, which we monitor alongside deflection and automation to ensure efficiency gains don't damage customer experience. We also track NPS (currently 47) to verify AI implementation supports long-term loyalty. CSAT is our primary optimization metric because it directly reflects AI interaction quality."
Improve your Data Quality
Before you calculate a single metric, answer this question: What conversations are you counting?
Get this wrong, and every number you report will be misleading.
The "All Conversations" Problem
I’ve seen lots of teams calculate metrics like this:
Deflection Rate = (AI-only conversations / All conversations) × 100
Sounds reasonable. But it could be even better.
"All conversations" include:
- ❌ Customers who typed "hi" and left
- ❌ Test conversations from your team that forgot to use staging
- ❌ Chitchat, Spam, and bot traffic
- ❌ Accidental clicks with no input
- ❌ People who opened chat and immediately closed it
Real example:
- 1,000 chat sessions opened
- 300 said "hi" or "test" and bounced
- 700 asked actual business questions
- 525 handled by AI without escalation
Wrong calculation: 525 / 1,000 = 52.5% deflection
Right calculation: 525 / 700 = 75% deflection
The second number actually means something. It tells you how your AI performs when customers need help, not how many people abandon before asking anything.
Use "Business Conversations" as Your Denominator
Business Conversation = A conversation where the customer expressed at least one substantive business need.
Include:
- ✅ Questions about products or services
- ✅ Requests for support or help
- ✅ Complaints or issues
- ✅ Account or order inquiries
Exclude:
- ❌ Greeting-only sessions ("hi", "hello" with no follow-up)
- ❌ Chitchat
- ❌ Spam or bot traffic if you can identify and remove
- ❌ Sessions with zero customer input
- ❌ Conversations that ended before expressing intent
Every formula could potentially use this denominator:
Metric = (Numerator / Total Business Conversations) × 100
The Even Bigger Insight: Track Issues, Not Just Conversations
Here's what most teams miss: customers often have multiple questions in one conversation.
Example: Customer: "I need to reset my password."
AI: [Completes password reset]
Customer: "Also, where's my order #12345?"
AI: [Shows order status]
Customer: "Can I get a refund on that order?"
AI: "Let me transfer you to a human agent."
Conversation-level view:
- 1 conversation
- Escalated to a human agent
- Deflection: 0%
- Automation: 0%
Issue-level view:
- 3 issues identified
- 2 issues resolved by AI (password reset, order status)
- 1 issue escalated (refund)
- Deflection by issue: 67%
- Automation by issue: 67%
Which view gives you better insights?
How to Implement Issue-Level Tracking
Use metadata tagging or context variables to mark when customers enter workflows and when they complete them. Depending on how your AI agent is structured, you will want to find ways to proactively append tags at runtime (every time a customer enters and exits a flow a tag is appended), or as conversation review workflows advance, I think it’s likely language models will in the future be able to tag issues in conversations after they have happened, which will also be better for workflows that are more “agentic” in nature and less structured.
When the customer starts a workflow:
- Tag: issue_started: password_reset
- Tag: issue_started: order_status
- Tag: issue_started: refund_request
When the customer completes that workflow:
- Tag: issue_completed: password_reset
- Tag: issue_completed: order_status
- Tag: issue_failed: refund_request
Then calculate:
Automation Rate = (Issues completed / Issues started) × 100
When to Use Conversation-Level vs Issue-Level Tracking
Use conversation-level for:
- Deflection rate (Did this conversation need a human?)
- Containment rate (Did the customer return?)
- CSAT (How was the overall experience?)
- NPS (Would they recommend us?)
Use issue-level for:
- Automation rate (Which workflows succeed?)
- Solution ratio (Which issue types get resolved?)
- Dropoff analysis (Where do customers get stuck?)
- Workflow performance comparison
Effective reporting approach: "We calculate all metrics using business conversations only - excluding greeting-only sessions and test traffic. For automation and solution metrics, we track at the issue level because customers often have multiple questions per conversation. This gives us actionable insights into which specific workflows need improvement."
Quick Reference: AI Contact Center Metrics Comparison
How to Report AI Metrics Effectively
When presenting AI performance to contact center leaders or executives, context matters as much as the numbers themselves. Here's a framework that provides clear, actionable insights.
Rule 1: Lead With Customer Success, Not Efficiency
Wrong approach:
"Our deflection rate hit 85%! We're saving $500K annually in agent costs."
Right approach:
"Our solution rate is 71%, meaning 71% of customers confirm their problems were solved. This efficiency translates to 82% deflection with an 80% CSAT, showing we're reducing costs without sacrificing customer experience."
Why it works: You've proven the efficiency gains come from actually helping customers, not from blocking them.
Rule 2: Call Out Your Measurement Gaps
Wrong approach:
"Containment rate is 94%."
Right approach:
"We track containment across chat and email with high confidence, but can't yet track phone or social follow-ups. Based on channels we can measure (representing ~75% of customer contacts), containment is 78%. Keep in mind, only 50% of users are authenticated in any given AI Agent experience, and we can’t track containment if they are not authenticated."
Why it works: Acknowledging gaps makes your other numbers more credible.
Rule 3: Show How Metrics Connect
Never report a metric in isolation. Show relationships.
The pattern:
- Deflection is X% (efficiency)
- CSAT is Y% (experience)
- Solution rate is Z% (actual resolution)
Red flag combinations:
- "Deflection is 90%, CSAT is 45%" → You're blocking customers
- "Automation is 75%, solution rate is 45%" → Workflows don't help
- "Deflection is rising, NPS is falling." → AI is damaging loyalty
Green flag combinations:
- "Deflection is 70%, CSAT is 78%, solution rate is 68%" → Efficient and helpful
- "As deflection increased 15%, CSAT held steady at 65%" → Scaling without quality loss
Rule 4: Explain Your Denominator
Wrong approach:
"We automated 12,000 conversations last month."
Right approach:
"We automated 12,000 business conversations (excluding chitchat and non-business chats. We report the business-conversations number because it reflects actual AI performance."
Why it works: Proves you're not inflating numbers with junk traffic.
Rule 5: Be Honest When Metrics Look Bad
Wrong approach:
[Quietly drops solution rate from the report]
Right approach:
"Our deflection rate is strong at 78%, but the solution rate dropped from 70% to 63% this month. Customer feedback indicates the password reset flow is confusing and often fails to deliver the reset link in a timely manner. We're redesigning it and expect the solution rate to recover by next quarter."
Why it works: You've shown you're watching the right things and acting on problems.
The Complete Honest Report Template
Executive summary: "Our AI handled 78% of inquiries without human escalation (deflection) with an 81% CSAT. Of these AI interactions, 72% resulted in confirmed resolution (solution rate). Based on cross-channel tracking of chat and email, 76% of customers didn't return through monitored channels (containment)."
What we track:
- Primary metric: Solution rate (customer-confirmed resolution)
- Supporting metrics: Deflection, automation, CSAT
- Strategic monitoring: NPS, containment
- Data quality: Calculated on business conversations only (excludes greeting-only sessions)
What we can't track yet:
- Phone and social media containment (working on integration)
- Issue-level granularity (implementing metadata tagging next quarter)
Concerning trends:
- Refund issue: CSAT dropped to 68% (investigating)
- Account management automation at 45% (significantly below other flows)
Actions taken:
- Redesigning refund escalation logic
- Adding a confirmation step to account workflows
- Implementing issue-level tracking for better workflow insights
6 Common Metric Pitfalls and Their Impact
Pitfall #1: Tracking Deflection Without CSAT
What happens: High deflection numbers without visibility into customer experience
The impact: May indicate customers can't reach help when needed
Better approach: Pair deflection with CSAT to validate that efficiency gains come from solving problems, not blocking access
Pitfall #2: Celebrating Automation Without Customer Confirmation
What happens: High workflow completion rates without measuring outcomes
The impact: Customers may complete processes that don't solve their problems
Better approach: Track solution rate alongside automation to verify that completed workflows deliver value
Pitfall #3: Reporting Containment Without Cross-Channel Tracking
What happens: Claiming high containment while only monitoring one channel
The impact: Missing customers who escalate through phone, email, live messaging, or social media
Better approach: Acknowledge which channels you can track and report containment with a clear scope
Pitfall #4: Restricting Agent Access to Improve Deflection
What happens: Making escalation difficult to boost deflection metrics
The impact: Frustrated customers, decreased satisfaction, erosion of trust
Better approach: Provide clear escalation paths and measure whether AI earns deflection through value
Pitfall #5: Calculating Metrics on All Traffic
What happens: Including test sessions, bots, and greeting-only conversations
The impact: Inflated metrics that don't reflect AI performance on real customer needs
Better approach: Filter to business conversations with substantive customer requests
Pitfall #6: Only Tracking Conversation-Level Data
What happens: Missing granular insights when customers have multiple issues
The impact: Can't identify which specific workflows succeed or fail
Better approach: Implement issue-level tracking for automation and solution metrics
Why These Metrics Matter
Through working with contact center leaders on AI implementations, I've seen how the right metrics can transform an AI project from a promising pilot to a scalable success - and how the wrong ones can derail even technically excellent systems.
When you track metrics that reflect actual customer outcomes - solution rate, automation rate, CSAT - you build credibility with stakeholders. You can have productive conversations about what's working and what needs improvement (and why you need more budget!).
Clear measurement creates:
- Alignment between technical teams and business objectives
- Data-driven decisions about which workflows to prioritize
- Confidence to scale AI implementations
- Honest conversations about progress and challenges
Your AI agent's success isn't just about the model or conversation design. It's about whether customers get help, whether their satisfaction improves, and whether you can accurately measure those outcomes.
Track the right things. Be clear about what you can and can't measure. Focus on customer outcomes alongside operational efficiency.
That's how AI agents move from pilot to production.
Frequently Asked Questions
What is a good deflection rate for AI agents?
Industry benchmarks range from 70-80%, but the number alone is meaningless. A 90% deflection rate with 60% CSAT means you're blocking customers from help. A 70% deflection rate with 85% CSAT means you're efficiently solving problems. Always pair deflection with CSAT and solution rate.
How is containment different from deflection?
Deflection measures whether a human agent was needed to support the conversation. Containment measures whether the customer returned through ANY channel for the same issue. Deflection tells you the AI didn't hand off. Containment (if you can truly track it well) tells you the problem was actually solved.
What's the difference between automation rate and solution rate?
Automation measures process completion - did they finish the workflow? Solution rate measures problem resolution - did they confirm it helped? Customers can complete entire workflows while their problems remain unsolved. I would recommend optimizing for solution rate, not automation, where you can.
How do you collect customer feedback for the solution rate?
Ask immediately after providing a solution: "Did this resolve your issue?" with Yes/No options. Collect feedback after EVERY interaction, not just successful ones. Use simple binary feedback (thumbs up/down) or a 5-star scale, with 4-5 indicating satisfaction. Request feedback while the experience is fresh, not days later.
Why do AI agents need different metrics than human agents?
AI can easily fake success - high deflection (blocked agent access), high automation (completed confusing workflows), high containment (customers gave up). Human agent metrics assume the human agent is trying to help. AI metrics must prove the AI actually helped, not just that it completed processes.
What's the most important metric for contact center AI?
In my opinion, it is the Solution rate. It is my north star metric because it's the only metric that requires customer confirmation that their problem was solved. Deflection, containment, and automation can all be gamed or misinterpreted. Solution rate directly measures whether your AI helps customers.
What is a good CSAT score for AI agents?
Target 65-85% for AI agents, but compare to your human agent CSAT for context. More important than the absolute score is the trend: CSAT should remain stable or improve as you increase deflection and automation. If CSAT drops while deflection rises, you're optimizing the wrong things.
Should CSAT be measured differently for AI agents vs human agents?
No. Use identical CSAT scales for AI and human agents to directly compare performance. Track them separately to understand where AI excels (simple workflows, information requests) and where humans are needed (complex problems, emotional situations).
What's the difference between CSAT and NPS for AI agents?
CSAT measures satisfaction with a specific interaction (transactional). NPS measures the likelihood to recommend your company (relational). For AI agents, CSAT directly reflects AI quality and gives actionable optimization data. NPS is influenced by dozens of factors beyond the AI agent interaction.
Should I use CSAT or NPS to measure my AI agent's success?
I would recommend using CSAT as your primary AI agent optimization metric - it directly measures interaction quality. Monitor NPS strategically to ensure AI agents don’t undermine overall brand loyalty, but I wouldn’t optimize AI agents based on NPS. You could be chasing signals caused by pricing, product quality, and competitors, not AI performance.
What is a good NPS score when using AI agents?
Compare your NPS to your baseline before AI implementation, not to industry benchmarks. The critical question: Does NPS stay stable or improve as AI usage increases? If NPS drops significantly while deflection rises, your AI is damaging customer relationships.
Should I calculate metrics based on all conversations or only business conversations?
There is a strong case for focusing on tracking business conversations (those with at least one substantive question). Including "hi and goodbye" sessions, tests, and spam will artificially inflate your metrics. Calculate on real customer interactions to measure actual AI performance.
What's the difference between conversation-level and issue-level tracking?
Conversation-level counts each chat as one unit. Issue-level recognizes customers often have multiple questions per conversation (password reset + order status + refund = 3 issues). Issue-level tracking reveals which workflows succeed and which fail, even in conversations that escalate.
How do I implement issue-level tracking for my AI agent?
Tag when customers enter workflows (issue_started: password_reset) and when they complete them (issue_completed: password_reset). Most AI platforms support this through flow tracking; however, less structured systems might benefit from post-production tagging with a language model. Calculate automation rate as (completed issues / started issues) instead of (completed conversations / total conversations).